Visualizing physical hardware costs
Managing physical hardware is a diligent process of bookkeeping. Tracking everything from an email message to added/removed hardware components was tedious, for each request to the provider, one had to not to forget to fill what was changed and leave remarks.
Over a year ago we have chosen to use OSS Ralph[1] - lightweight assets management system. Reason for this was to keep track of liquidated, free and in use servers. Soon we wanted to see other basic components: CPU, RAM, DISK, NIC. By no means, no one wanted to go through each server by hand. We have solved this using automation.
First of all, there are 3 sources of truth: the invoice, Ralph and Chef. By comparing three sources we can find out the origin of the asset. For example, if the server is in invoice but not in Chef, the server is not bootstrapped or if the server is in Chef but not in the invoice - means we don’t pay for the server.
Vapi is the internal service which connects Chef and other SRE API’s. At the moment we have RESTful web service which serves as a middleman between Chef and Ralph. Chef has a recipe that runs on all machines where it collects hardware information. The payload is then POST’ed to Vapi which in turn processes request by comparing what is already in Ralph.
We have a special #ralph-monitoring channel where each change is tracked.
Furthermore ‘captain’ reports to #sre-hw channel about component changes reminding to update the price of the server.
This keeps other colleagues aware of hardware components changes.

Stats
Complete hardware audit and automation has been very fruitful so far. We identified many discrepancies between the invoice and reality, which will lead to us getting some money back. We now have a better view into our costs, which will enable more accurate capacity planning.
Here’s what we have discovered in the process:
- 5 servers were available but unused
- 7 virtual machines idling (no roles in Chef)
- 1 server marked in use but was free (no roles in Chef)
- 1 server marked in use but was liquidated
- 14 servers marked as liquidated but we were still paying for them
- 1 server was used (had roles assigned to Chef), but not in the invoice (free of charge)
- 2 servers were replaced though we had them as ‘in use’
Visualizing hardware
We can set special Chef attributes on machines based on what Ralph tags that machine already has.
Freerider
The freerider is a special tag which lets us distinguish machines that are registered in Chef but do not have roles.
If a server is freerider its Ralph status gets automatically updated as a free server.
Heartbeat
The heartbeat tag is a timestamp which tells us when the last checkout from Ralph happened.
The most important state is when the pulse is unknown that means the server is not registered in Chef.
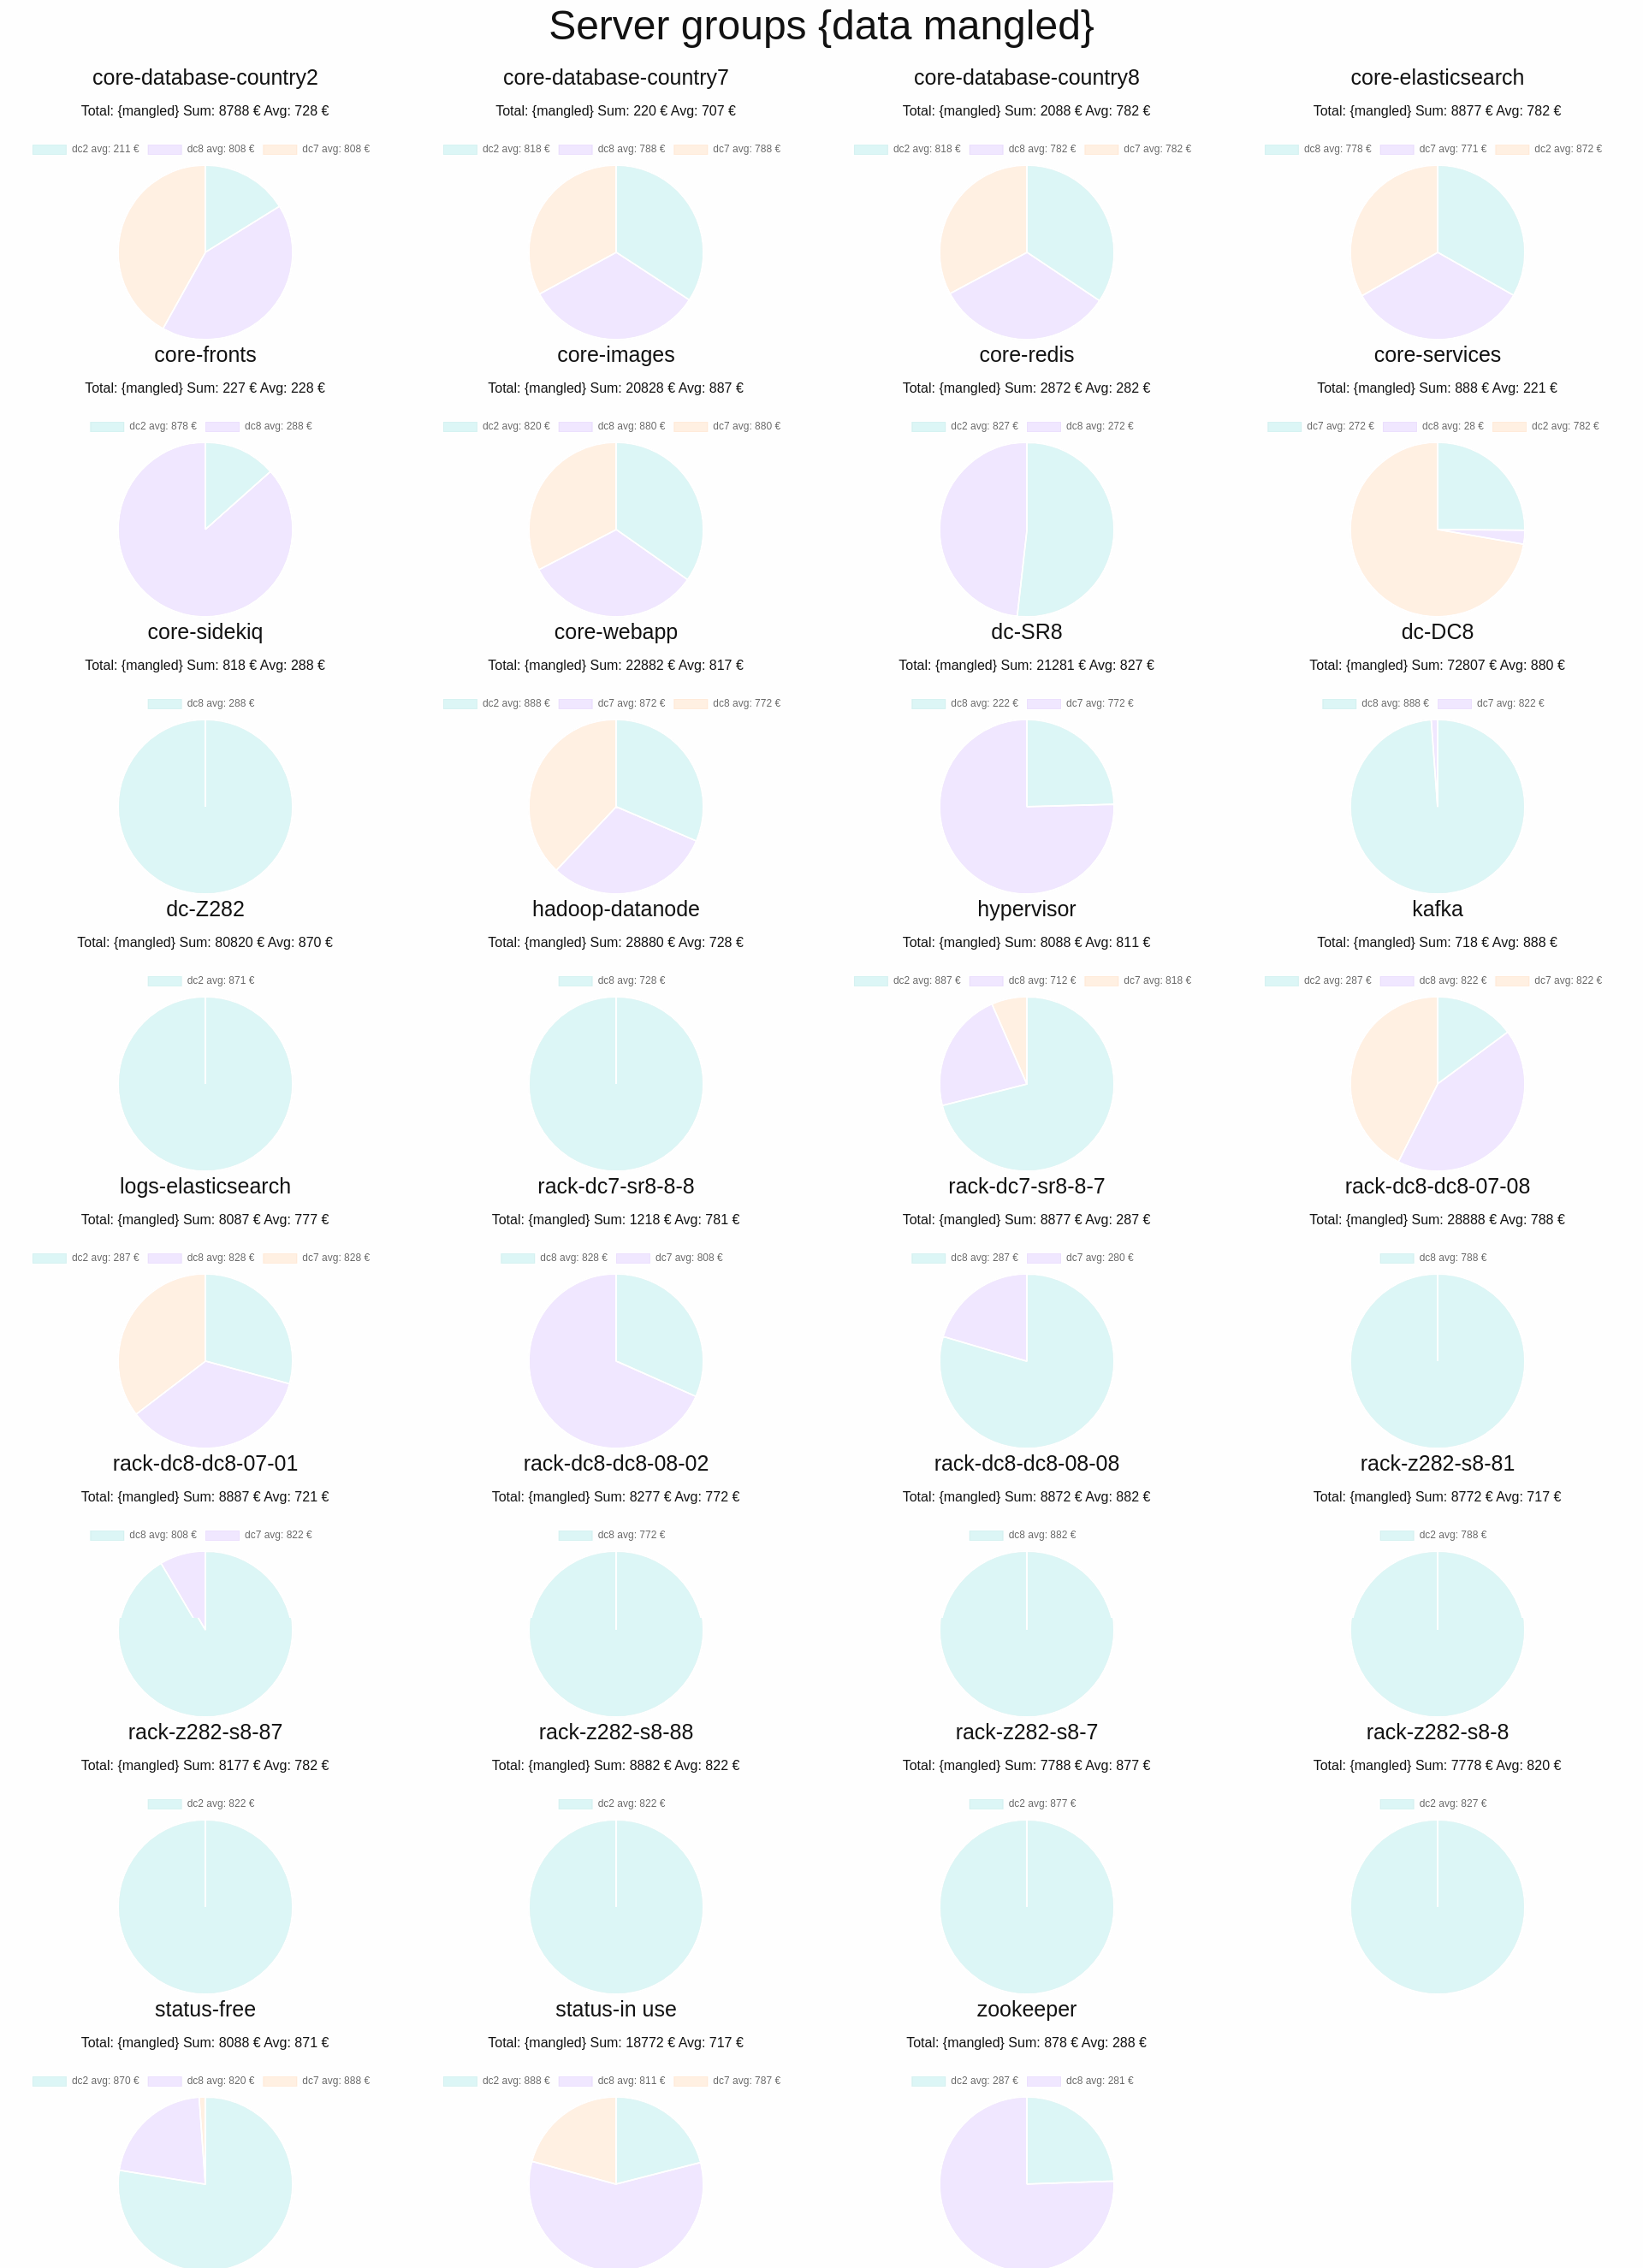
Server groups
The groups tag was added for each role where role represents cluster of databases,
service or specific country. This lets us have:
- view per status: free, in use, liquidated
- view per data center
- view per rack
- view per groups/roles
In summary
- Early hardware costs automation saves money
- Automating the server accounting becomes a necessity when running more than 100 servers
- Awareness of what parts of infrastructure cost most can influence future design decision and question whether right technology is used