One Year of Log Management at Vinted
Logs flow until they don’t. One year ago our centralised log management (LM) system became quite unstable. This often caused LM service outages and human intervention was required, sometimes several times a week.
In this post I’m going to give an overview of the improvements made to the log management system over the course of one year. As a result of the improvements, we now have quite a simple LM system design which is fault-resistant and easy to scale.
The Log Management Landscape Over a Year Ago
Big picture
I joined Vinted in the late spring of 2019 and soon received a task to improve the Vinted log management infrastructure.
The challenge was accepted.
Here’s a picture of what the LM infrastructure looked like in those days:
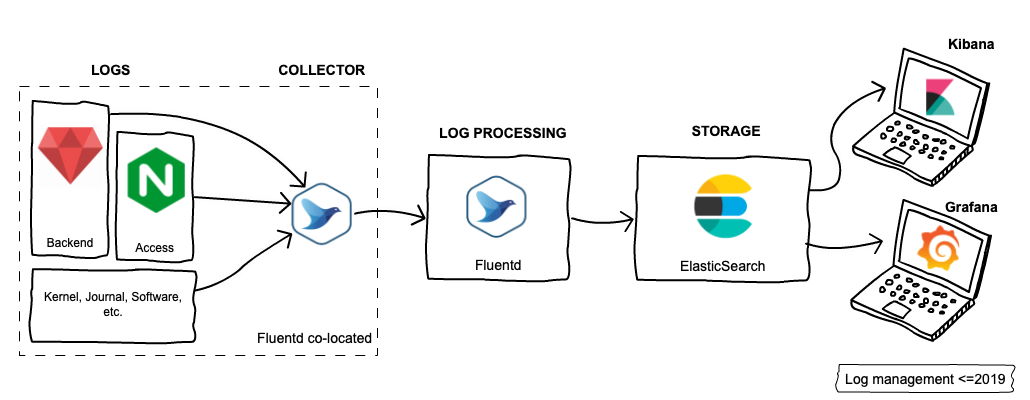 Here’s how it works: Backend apps, Nginx and other software write log records to log files. Fluentd agent runs co-located on the same machine and collects logs from these files. It then forwards the logs to central log aggregator instances, where received logs are processed. We use the same Fluentd software, but with different configurations. The processed logs are then sent to Elasticsearch for indexing… and it’s done. Engineers can now enjoy playing with logs using Kibana and Grafana.
All good, except everything is on fire 🔥
This log management design was more than enough for several years, until the log record flow rates exceeded the capabilities. The closer we came to peak traffic periods, the more often downtimes of LM occurred (I remember us dealing with LM downtimes at least once a week). There were multiple problems, and as an example I will use our largest log source - Nginx access logs.
Nginx generated quite a huge amount of access logs. Frontend servers with 240G SSD drives were capable of storing only 1 day’s worth of Nginx access logs. Logs were generated up to 8K records per second during peak hours. Fluentd (Ruby application) was struggling to keep up with the pace and lagged far behind. And then log rotation kicked in - as a new Nginx access log file was created, our Fluentd lost logs which were not collected yet ☹️ There was also another problem: SSD disks wear out quickly when such a large amount of disk writes are performed. The next victims were the central log processors, which received all the logs Fluentd clients have been able to send. They also got overloaded and crashed occasionally. Eventually, all the logs that log processors have been able to process needed to be indexed on Elasticsearch. Which also didn’t always ingest logs at such a rapid pace. Elasticsearch simply does not accept new records when it has no resources to index them. This cascaded back to log collectors. Log processors retried to send logs to Elasticsearch while not accepting new logs from log collectors. Log collectors were growing lag while log processors were not accepting logs…
There were some more problems (like Elasticsearch was not configured to be DC-aware, which made Elasticsearch nodes very painful to restart), but I’ll stop here 😉
To sum up, at that moment in time we had at least three bottlenecks to unclog. We also had poor visibility of the logs pipeline performance and capacity. With this in mind, the following goals of improving LM were born:
- Replace the resource-hungry Fluentd log collector with a more efficient one
- Collect Nginx access logs, bypassing writing them to disk
- Introduce buffer for logs before processing them
- Improve LM visibility by collecting metrics at every stage of log lifecycle
Current Log Management Landscape
Big picture
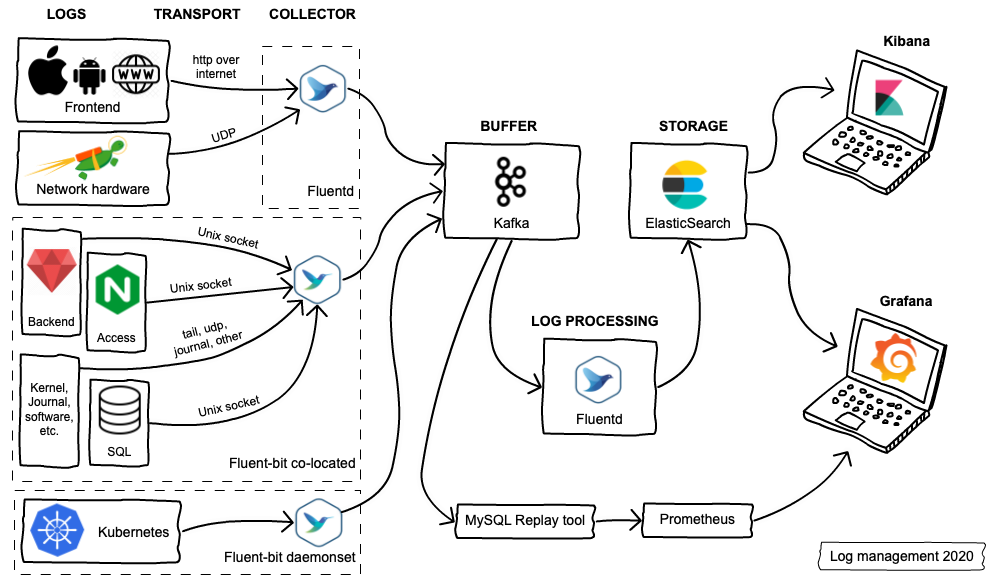
Our log management infrastructure has grown significantly in the last year. Some notable changes:
- Fluentd was replaced by Fluent-bit for collecting logs
- Kafka was added to the topology as a buffer
- Elasticsearch cluster was expanded from 6 data servers to 36, for a total of almost 1 petabyte of storage space
- New log sources were introduced (Network hardware, SQL Queries, etc.)
Unclogging log collectors
Let’s continue with the example of Nginx access logs. We made the following changes:
- Fluentd (written in Ruby) client was replaced by its younger brother Fluent-bit, which is written in C. Fluent-bit uses ten times less resources to perform the same operations as Fluentd.
- Nginx was configured to send logs to the Unix socket opened by Fluent-bit. This brought some peace for the SSD disks.
Fluent-bit gradually replaced all existing Fluentd configurations for collecting logs.
Introducing Buffer into the pipeline
With the great performance by Fluent-bit came the great possibility that it could be difficult for log processors to keep up with the log record rates received, especially when unexpected bursts happen. We decided to set up Kafka as a buffer before processing logs. This gave us some advantages:
- Lightweight configuration of Fluent-bit with only small in-memory buffers
- Handling huge bursts of logs with ease
- Ability to use different log processing software for different logs
- Easy introduction of additional tools to the pipeline
- Survival of downtime of log processors or Elasticsearch without losing logs
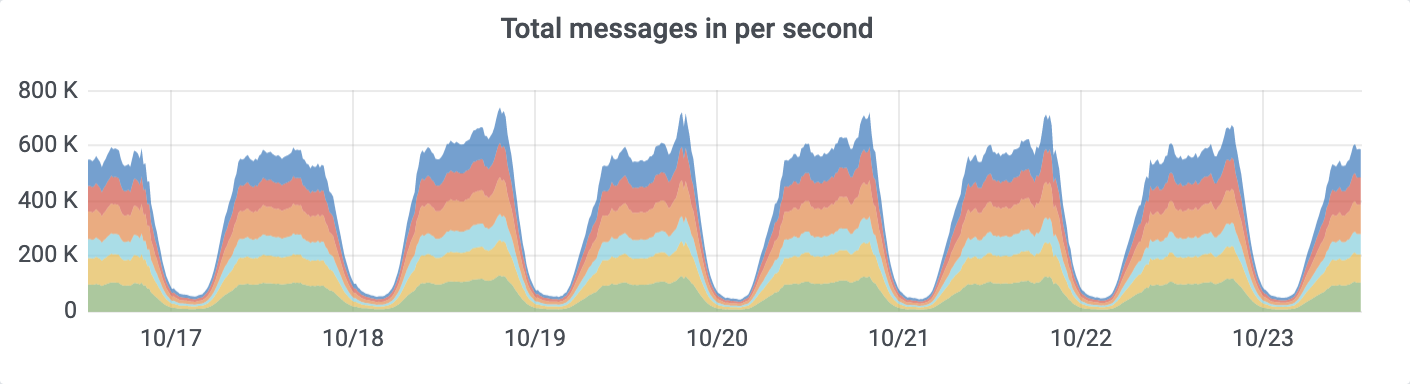
Currently, ~700K records per second flow into Kafka cluster during peak hours:
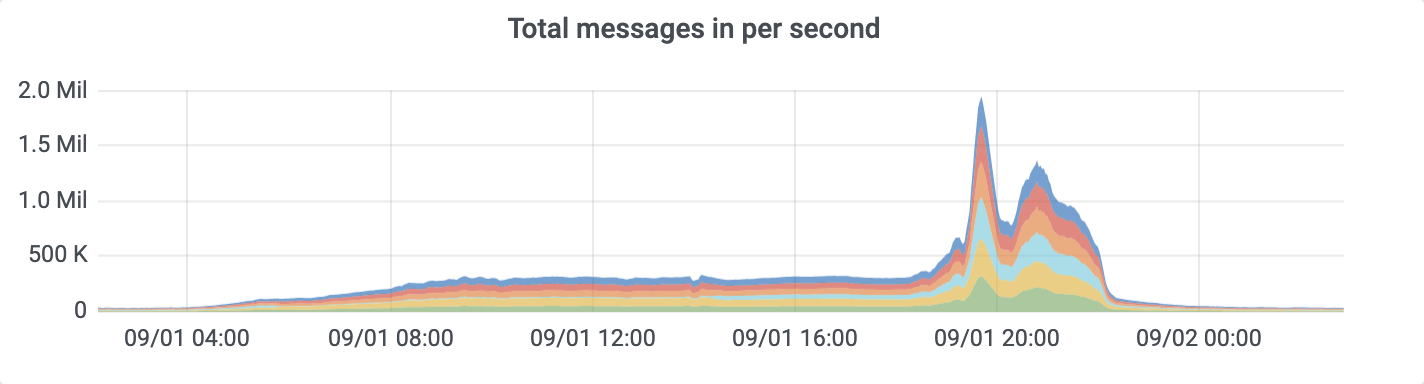
Sometimes it bursts up to 2M records per second:
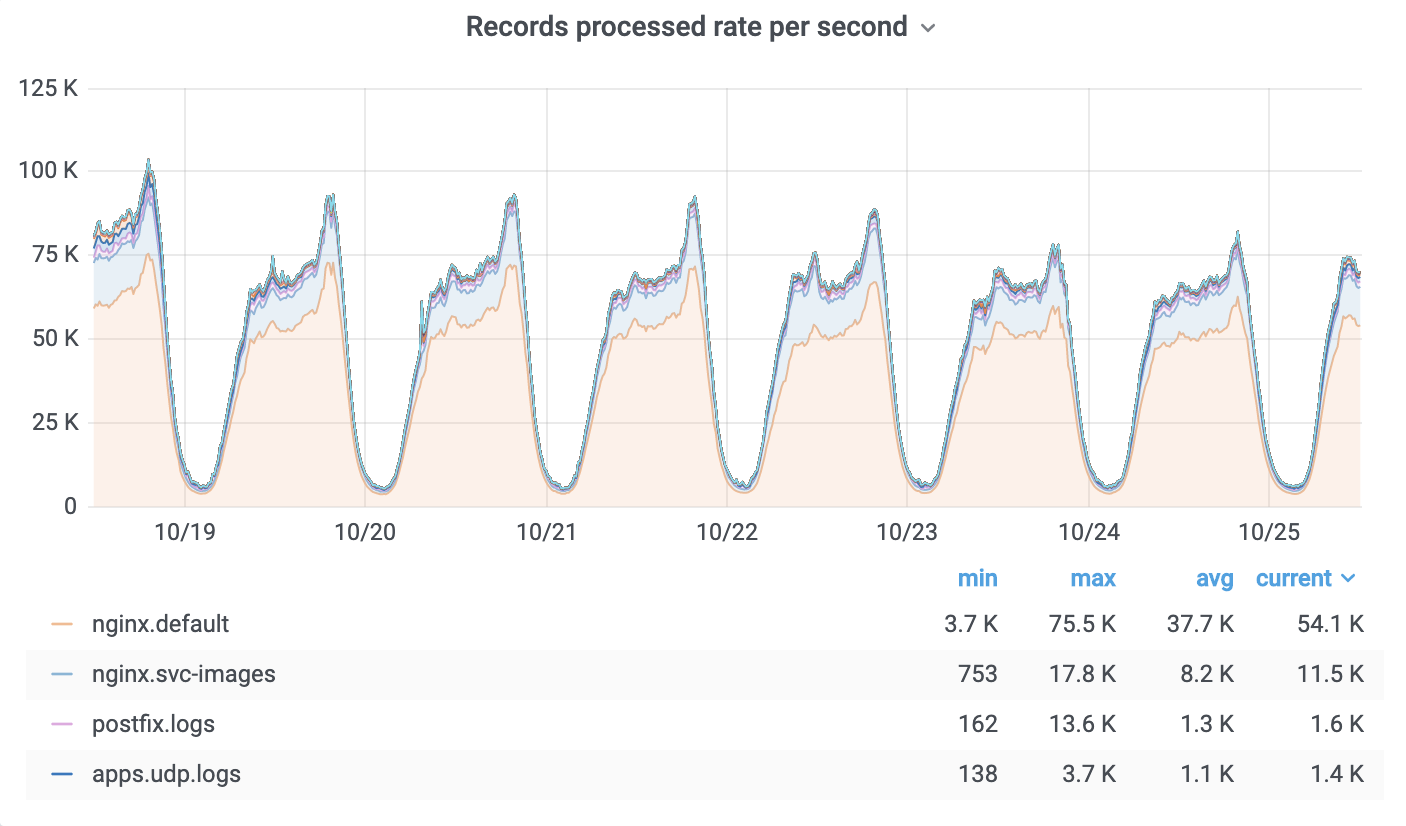
Log processing
No big revolution happened in this part. We kept using Fluentd for log processing, just updated it to the latest next generation version, which had a lot of stability/performance improvements. Current log processing rates:
Elasticsearch improvements
In addition to the cluster growing from 6 to 36 servers, we made the following improvements:
- upgraded Elasticsearch version from v5.x to v6.8 (7.9 upgrade is
pendingcompleted while this post was being written). - enabled Shard allocation awareness! This one was very low hanging fruit - easy to configure and it had a huge impact on the cluster stability. Now we can disable a whole data centre and Elasticsearch should not go to RED state (didn’t try that yet though🤞).
Visibility
All the tools used for the log management export metrics are in Prometheus format. The metrics provided enable us to monitor the whole log pipeline. We can see the rates and volume of logs collected and delivered to Elasticsearch. This enables us to:
- Plan capacity before we hit bottlenecks
- Identify and respond to failures quickly
New log sources added
All the improvements mentioned above have made it possible to expand on log sources and use cases. Our newly introduced log sources include:
- Network hardware logs
- Kubernetes logs
- Frontend exception logs
- Raw SQL queries logged from backend app requests (these are used for various performance tests)
Wrapping Up
Over the last year, the log management solution became quite boring from a maintenance perspective - you can sleep well during nights and weekends. There will be no emergency actions needed if one or a couple of servers go out of order (Kafka or Elasticsearch or both). Expanding Kafka or Elasticsearch clusters is easy - just bootstrap a new server and it will join the cluster, rebalance will happen automatically.
References
I will leave here an amazing short video about Log streaming which inspired me a lot: