Vinted Search Scaling Chapter 6: 4th generation of Elasticsearch metrics
An old fact from 2014 December 12th was significant for Vinted: the company switched from Sphinx search engine to Elasticsearch 1.4.1. At the time of writing this post, we use Elasticsearch 7.15. Without a doubt, a lot has happened in between. This chapter will focus on Elasticsearch metrics, we will share our accumulated experiences from four generations of collecting metrics.
Managing search requires both product and engineering efforts – two complementary parts. At Vinted, search engineers work with product, maintain a sound infrastructure, set up a scalable indexing pipeline and upscale search throughput performance; this is unattainable without proper metrics.
The first generation of metrics were collected by parsing /_cat API’s using Ruby scripts. Nothing sophisticated, we ran Elasticsearch version 1.x - 2.x and monitoring was done on demand with Elasticsearch plugins, such as ElasticHQ.
The second generation ran on the Sensu observability pipeline. Graphite was used as a persistence layer for storing collected Elasticsearch metrics, which we used to collect metrics of indices, shards and segments. We ran Elasticsearch version 2.x - 5.x at that time, monitoring segments was important as fine-tuning of the segmentation policy improved reading performance. The drawback was in the storage layer. Graphite would apply sampling on metrics spanning over a longer period. Sampling was the main pain point in moving to another storage engine.
The third generation of metrics ran on the pull-based metrics collection system, Prometheus. Prometheus was not yet established as a de facto monitoring system. At that time, we ran Elasticsearch version 5.x, just as open-source Elasticsearch exporters emerged. Numerous open-source Elasticsearch exporters were tried out. We used the video streaming company’s one. During that time, as our infrastructure grew, the exporter failed to deliver by occasionally running out of memory or timing out on /metrics endpoint requests. The exporter lacked fine-grained configuration functionality, such as limiting unnecessary metrics and configuring polling time per subsystem. Metrics were static, and the naming of metrics was inconsistent. The authors did not accept code change requests from the OSS community, no active delivery was done, and new metrics from recent Elasticsearch versions weren’t introduced. The in house fork was branched out from the upstream Elasticsearch exporter repository, it became apparent that the forked exporter was beginning to look like a complete rewrite. The efforts of rewriting were so significant, we decided to write a completely new exporter instead.
The fourth generation of Elasticsearch exporter solves multiple problems. It can:
- Work with large clusters (400+ nodes)
- Handle large amounts of metrics without crashing (exporter was able to export 940,272 metrics)
- Inject custom metric labels
- Handle ephemeral states of nodes, indices and shards
- Automatically generate new metrics and remove stale ones based on user-configurable lifetime
- Keep track of cluster state metadata node changes, cluster version and shards relocations
The new Elasticsearch exporter is written in the Rust programming language and is open-sourced on GitHub: github.com/vinted/elasticsearch-exporter-rs. The exporter uses asynchronous Tokio runtime, Rust Prometheus instrumentation library and the official Elasticsearch client library. Metrics collection is decoupled from the serving /metrics endpoint. In addition, Elasticsearch time-based metrics in milliseconds are converted into seconds to comply with Prometheus best practices (metrics ending in “millis” are replaced by “seconds”, “_bytes” and “_seconds” and postfixes are added where appropriate).
Namespace of subsystem (/_cat{aliases,shards,nodes,..}, /_nodes/{stats,info,usage}), / is preserved to the last leaf e.g.: elasticsearch /_nodes/info jvm mem heap_max. The JSON tree metric is converted to Prometheus format elasticsearch_nodes_info_jvm_mem_heap_max_in_bytes, this makes metric names intuitive to use.
Custom labels are injected into associated subsystems. For example, say the cluster version changes because of injection, one can distinguish metrics by the namespaced label vin_cluster_version. This allows the comparison of Elasticsearch performance between clusters and nodes during a rolling version upgrade. Cluster metadata is updated every 5 minutes by default, it is configurable by the user. Metadata updates are useful when the shard is relocated to another node or the node IP changes.
We reindex content completely and frequently (at most up to 2-3 times per day). Reindexing leaves a trace of state changes that exporters collect. Elasticsearch ephemeral state of nodes added/removed/drained, indices created, removed, and shards relocation, re-sharding, alias changes leave a lot of traces. The exporter handles this by keeping track of custom lifetimes per subsystem. Stale metrics are deleted when the last heartbeat of a metric with a unique label passes a predefined lifetime by the user. Metrics lifetimes help eliminate outdated metrics, save storage engine space and keep dashboards up-to-date.
Extensive configuration is possible via CLI flags. For instance, one can include or skip labels, skip metrics, define polling intervals between subsystems, enable/disable different subsystems and control metadata refresh intervals.
The best part of the exporter is that it does not define static metrics. Instead, metrics are dynamic, based on atomic structures, so subsystem metrics are constructed on every request. The dynamic nature of metrics does not require us to define new metrics when the Elasticsearch version changes or remove deprecated ones, so no metrics maintenance is needed. Adding new metric subsystems is easy, but that rarely happens.
At the moment, the exporter supports the following subsystems:
=^.^=
/_cat/allocation
/_cat/shards
/_cat/indices
/_cat/segments
/_cat/nodes
/_cat/recovery
/_cat/health
/_cat/pending_tasks
/_cat/aliases
/_cat/thread_pool
/_cat/plugins
/_cat/fielddata
/_cat/nodeattrs
/_cat/repositories
/_cat/templates
/_cat/transforms

/_cluster/health
/_cluster/stats

/_nodes/stats
/_nodes/usage
/_nodes/info

/_stats
Metrics generation code is a little over 1600 lines of code, split between 36 files.
You can try running the exporter from a docker container by using the command below:
$ docker run --network=host -it vinted/elasticsearch_exporter --elasticsearch_url=http://IP:PORT
The exporter also exposes metrics about itself.


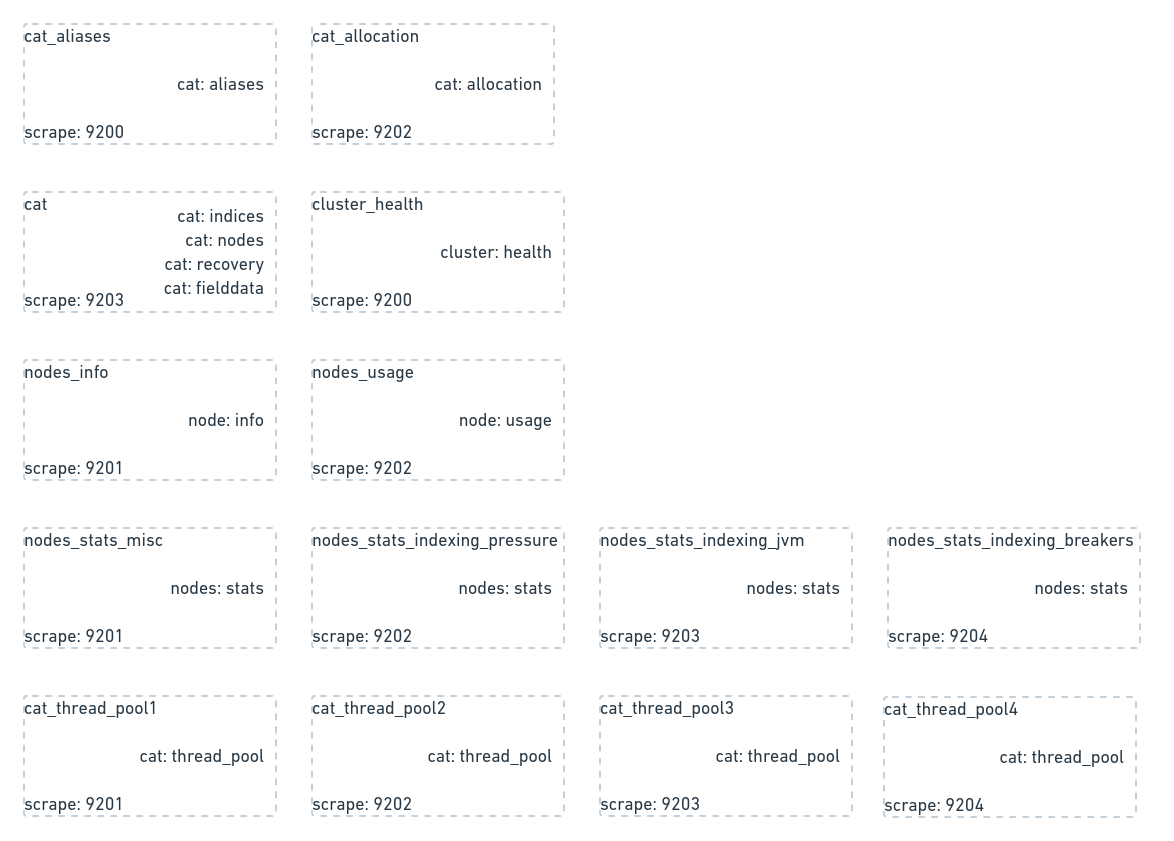
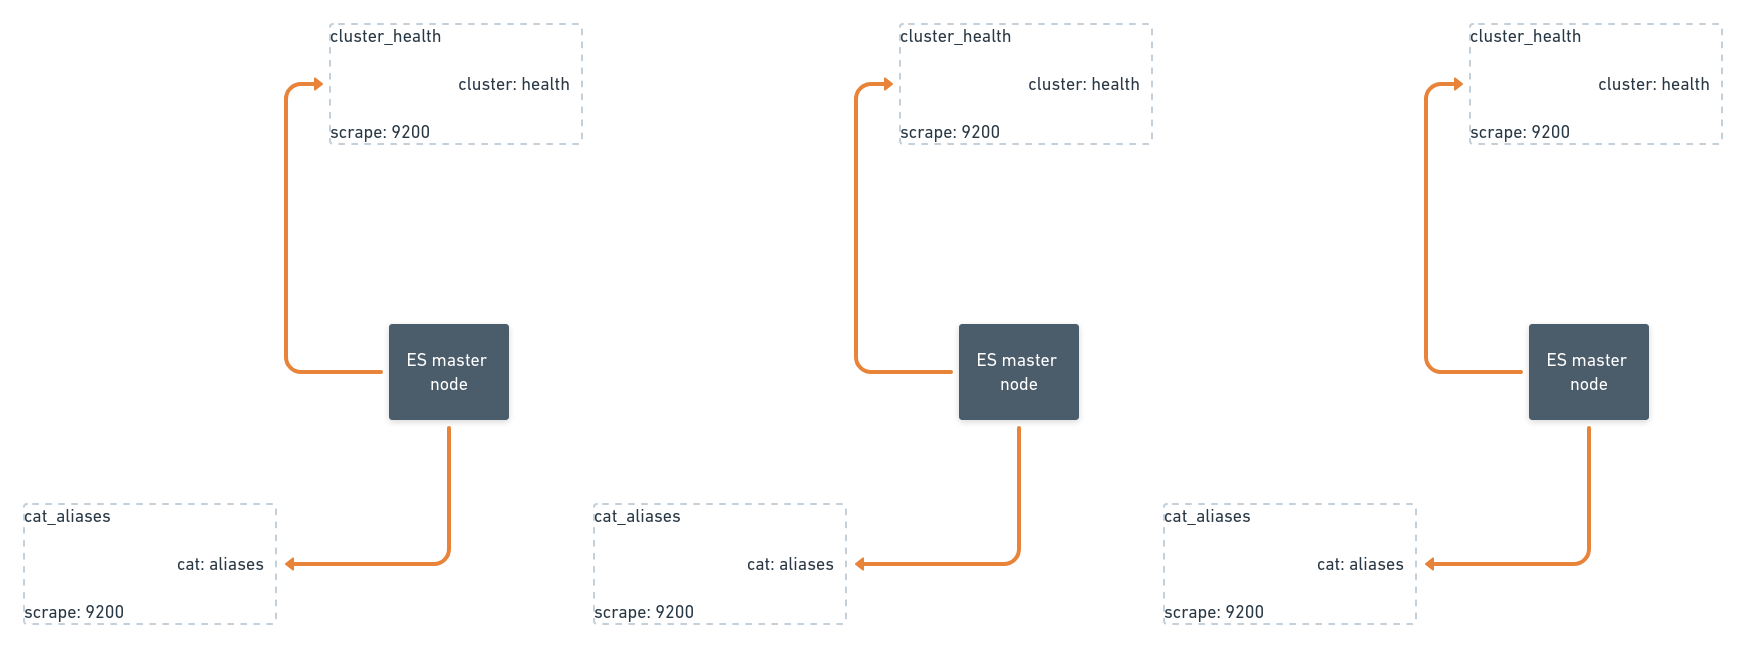
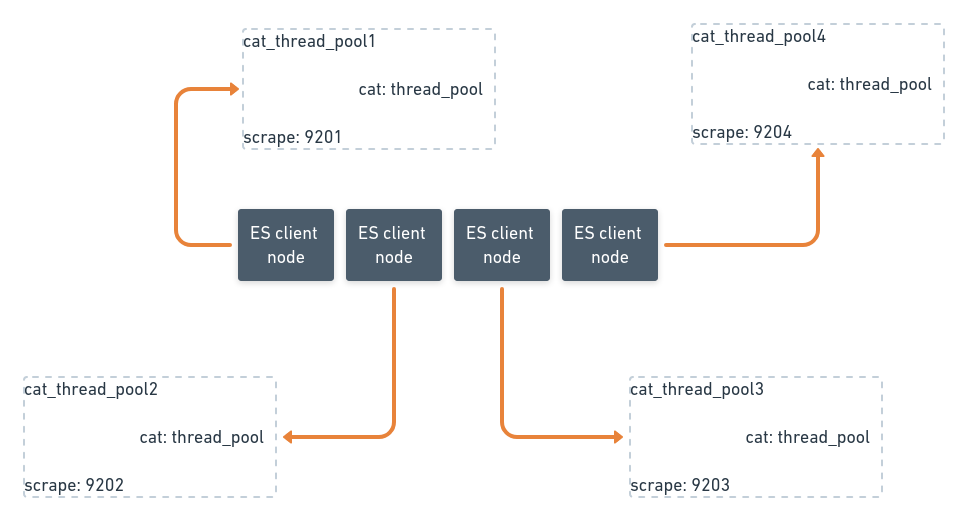
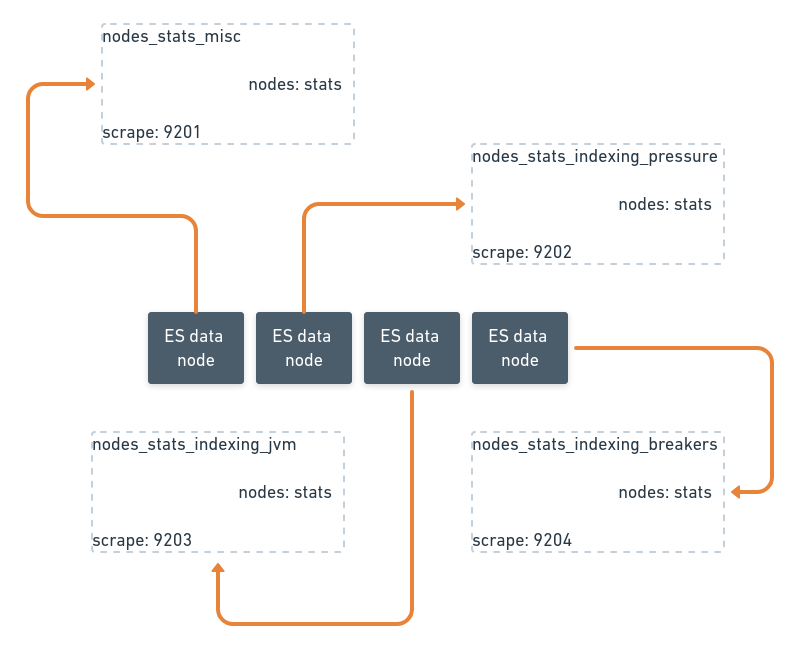
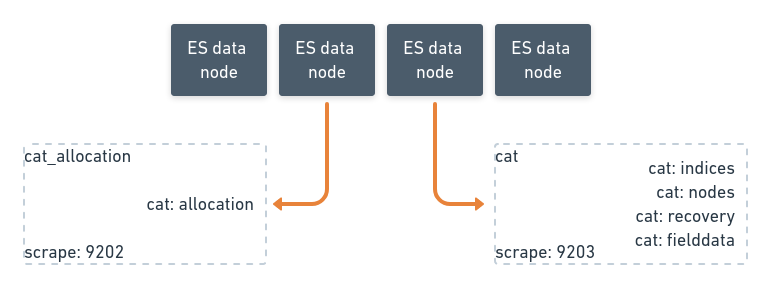
This is a sneak peek of Vinted’s Elasticsearch metrics infrastructure topology. The search infrastructure spans 3 data centers. We run one Elasticsearch cluster per data center. Each exporter is triplicated for high availability between data centers and racks inside a data center. Exporters generally serve 1 purpose: either scraping the full subsystem or parts of a single subsystem as in the case of a rich subsystem such as /_nodes/stats. Exporters run side-by-side to Elasticsearch nodes in docker containers and are configured using Chef.

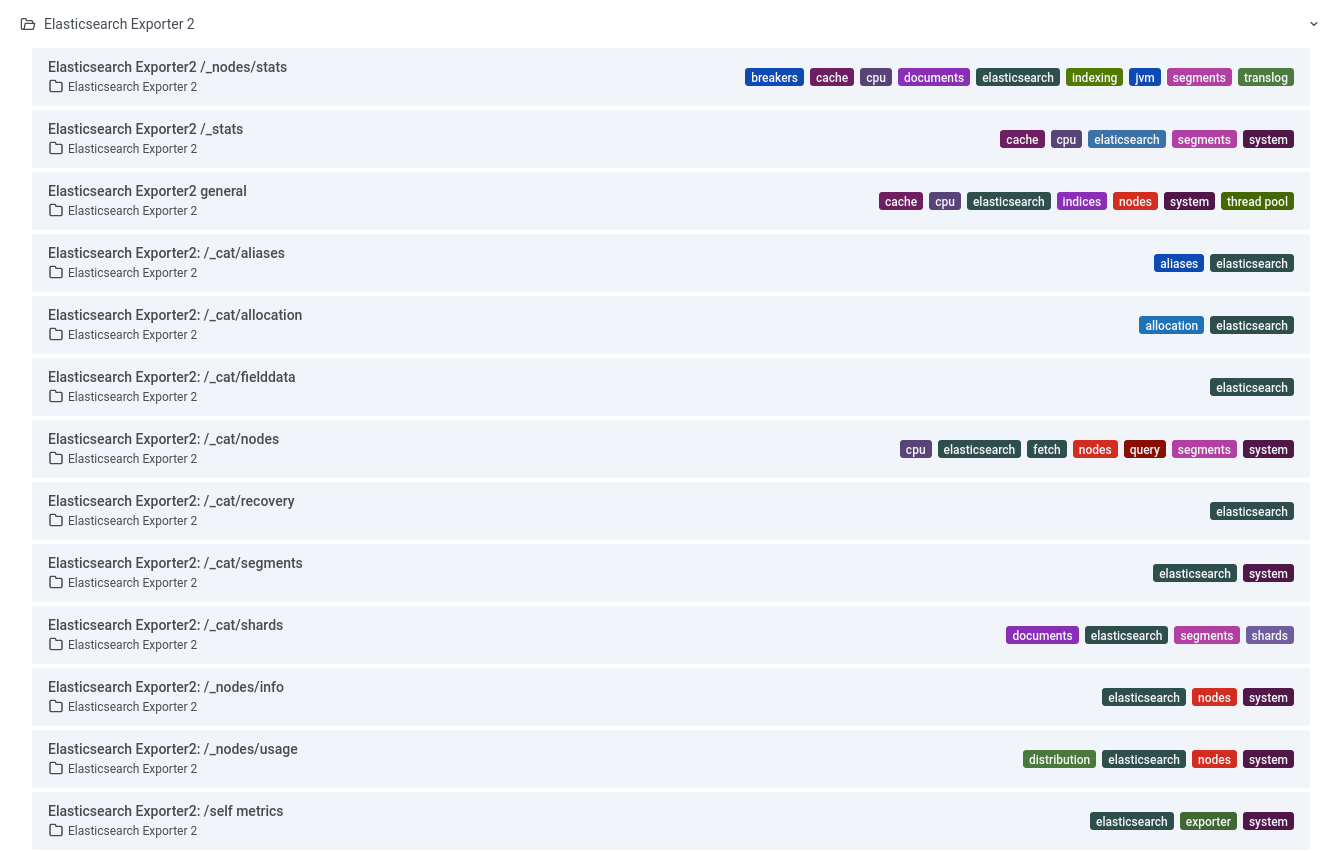
We are also open-sourcing 13 dashboards that collectively have about 323 panels exposed by various exporter subsystems.
Enjoy.
If you liked what you just read, we are hiring Search engineers! Find out more on our Jobs page.